.jpg)
Read article

Analysis, stage gates, evaluations, engineering judgement, expert insight, stakeholder consultation: whatever the activity, the output is a document. A brief for an internal workshop. A deck for a steering group. A set of tables in an appendix nobody reads but everybody needs.
The work and the insight happen in collaborative workshops and in specialist software. The deliverable still ends up as a written report or a slide deck.
Which is why moving content out of Optioneer and into Word, Excel and PowerPoint is already one of the most common things our users do.
So we built a lot of Optioneer around that process, around being the best possible source for a report a subject matter expert was going to write.
Then the obvious caught up with us.
If we already hold the data - the options, the constraints, the costs, the local impacts, the project's own accumulated knowledge - then the only thing standing between that data and a draft report is knowing what the report needs to be. Who it's for. What template it follows. What internal knowledge belongs in it.
Answer those three questions and the most tedious part is done, leaving the expert to do the analysis and exercise judgement. So we did.
⚡ Optioneer AI Report Writer turns the route and site data you already have in your Optioneer workspace into a custom, written report draft. A desktop study that takes a consultant days is drafted in minutes and ready to issue in hours, built from the project's real data with every claim traceable to its source. Across the workflows below, that removes at least 75% of the time spent producing a first complete draft.
“An estimate of the percentage of the work covered through these documents would be 100% of the route summary and 60% of an options assessment report.” - Project Manager at a utility serving 4 million customers
This isn't a chatbot pointed at a blank page. It's a context engine built on Optioneer's data structure: every figure, layer and comment is already linked to the option it describes, and applied in line with how your organization works.
.png)
The data is labeled. Every dataset in Optioneer arrives knowing what it is - environmental designations, cultural heritage, hydrology, ecology, geology, land ownership - with the context that makes it interpretable. That is over 8,000 data layers across the US and 5,000 across Europe.
.png)
The metrics summarize each option quantitatively. Cost drivers, penalties, asset counts, terrain, crossings, proximity, constraint breaks. The figures a report is built around exist before the report does.
.png)
Local impacts are understood. Not simply that the route crosses a watercourse, but what crossing that watercourse at that point means: sensitivity, likely mitigation, why it matters here.
.png)
Your project's own knowledge is in there too. Comments and uploaded files carry the things that never make it into a dataset: the client's position, the constraint someone found on site, a record of historical engagements with local landowners, or a decision taken three months ago, and the reason for it.
.png)
Together, that gives Report Writer something no general-purpose tool has: a comprehensive context of a real project.
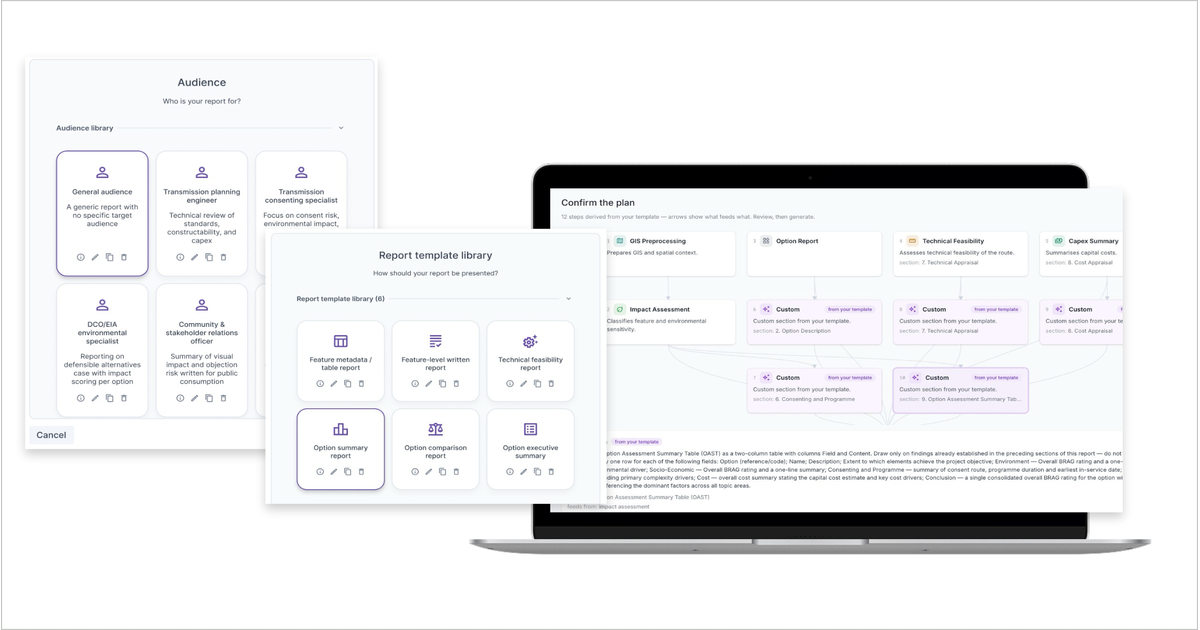
Pick the audience. A screening note for a GIS team and a full assessment for a planning authority are different documents. Say which one you're writing.
.png)
Pick the template. Your sections, your style, your structure. The report formats around what you actually want to get as a final deliverable.
.png)
Review the plan. Before a word is written, you see what the Report Writer intends to write and can change it.
.png)
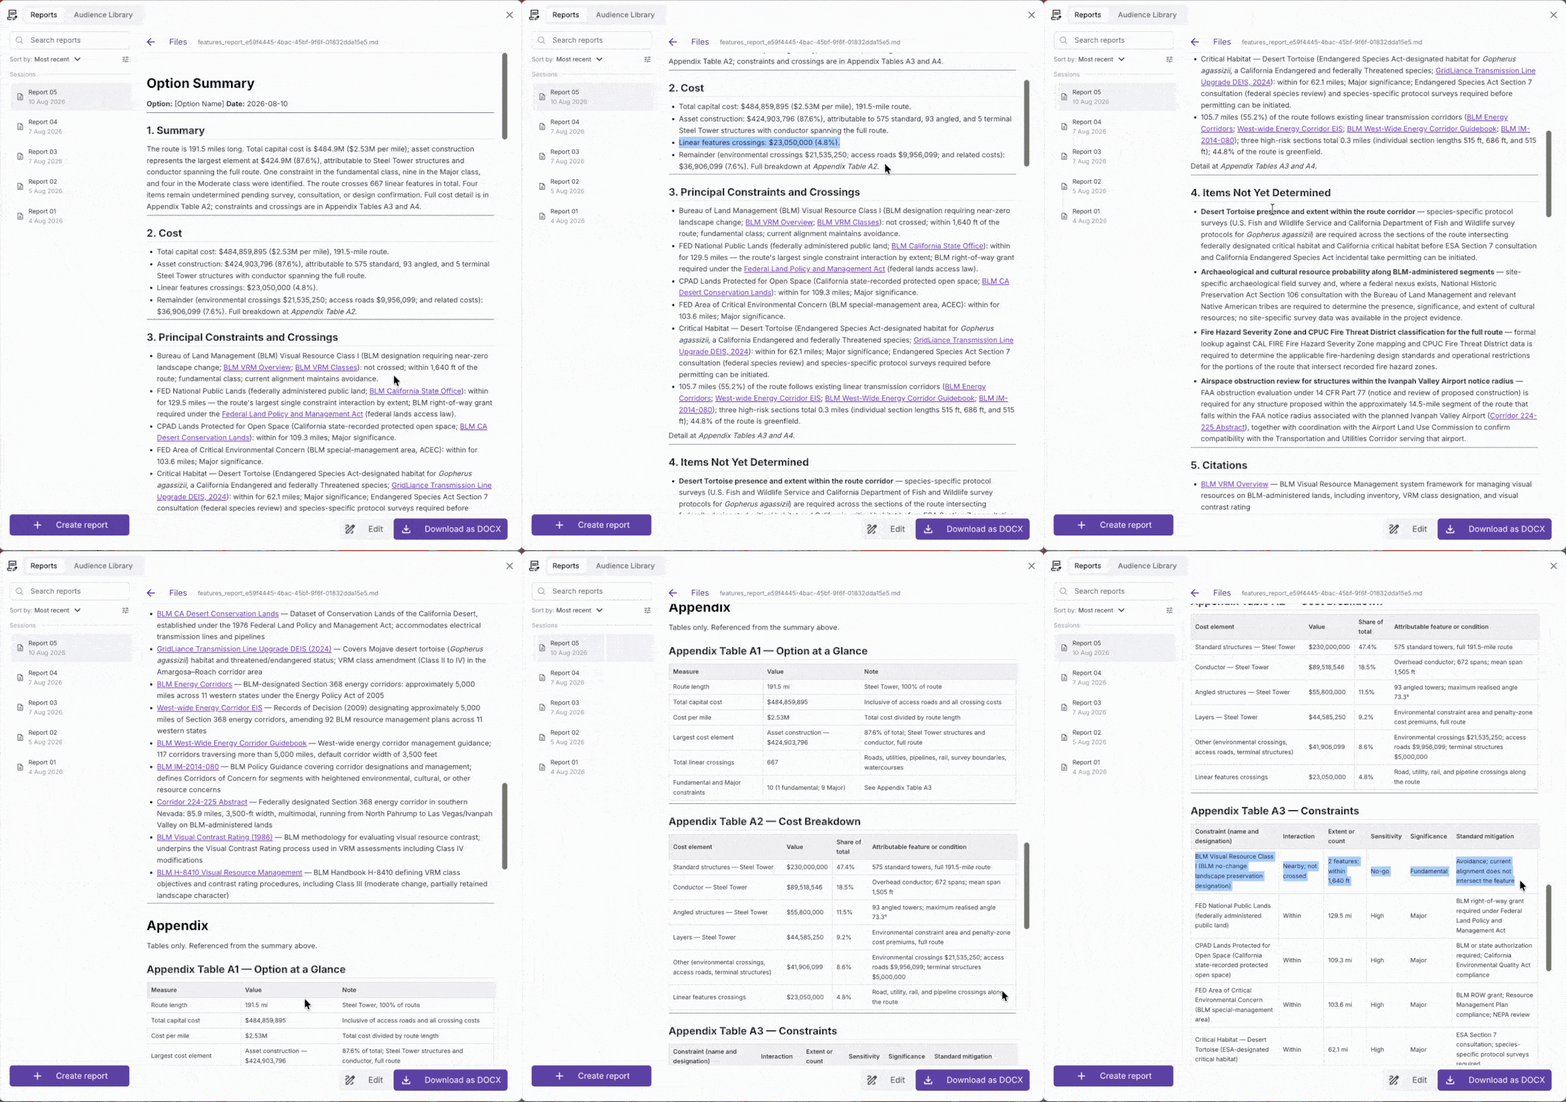
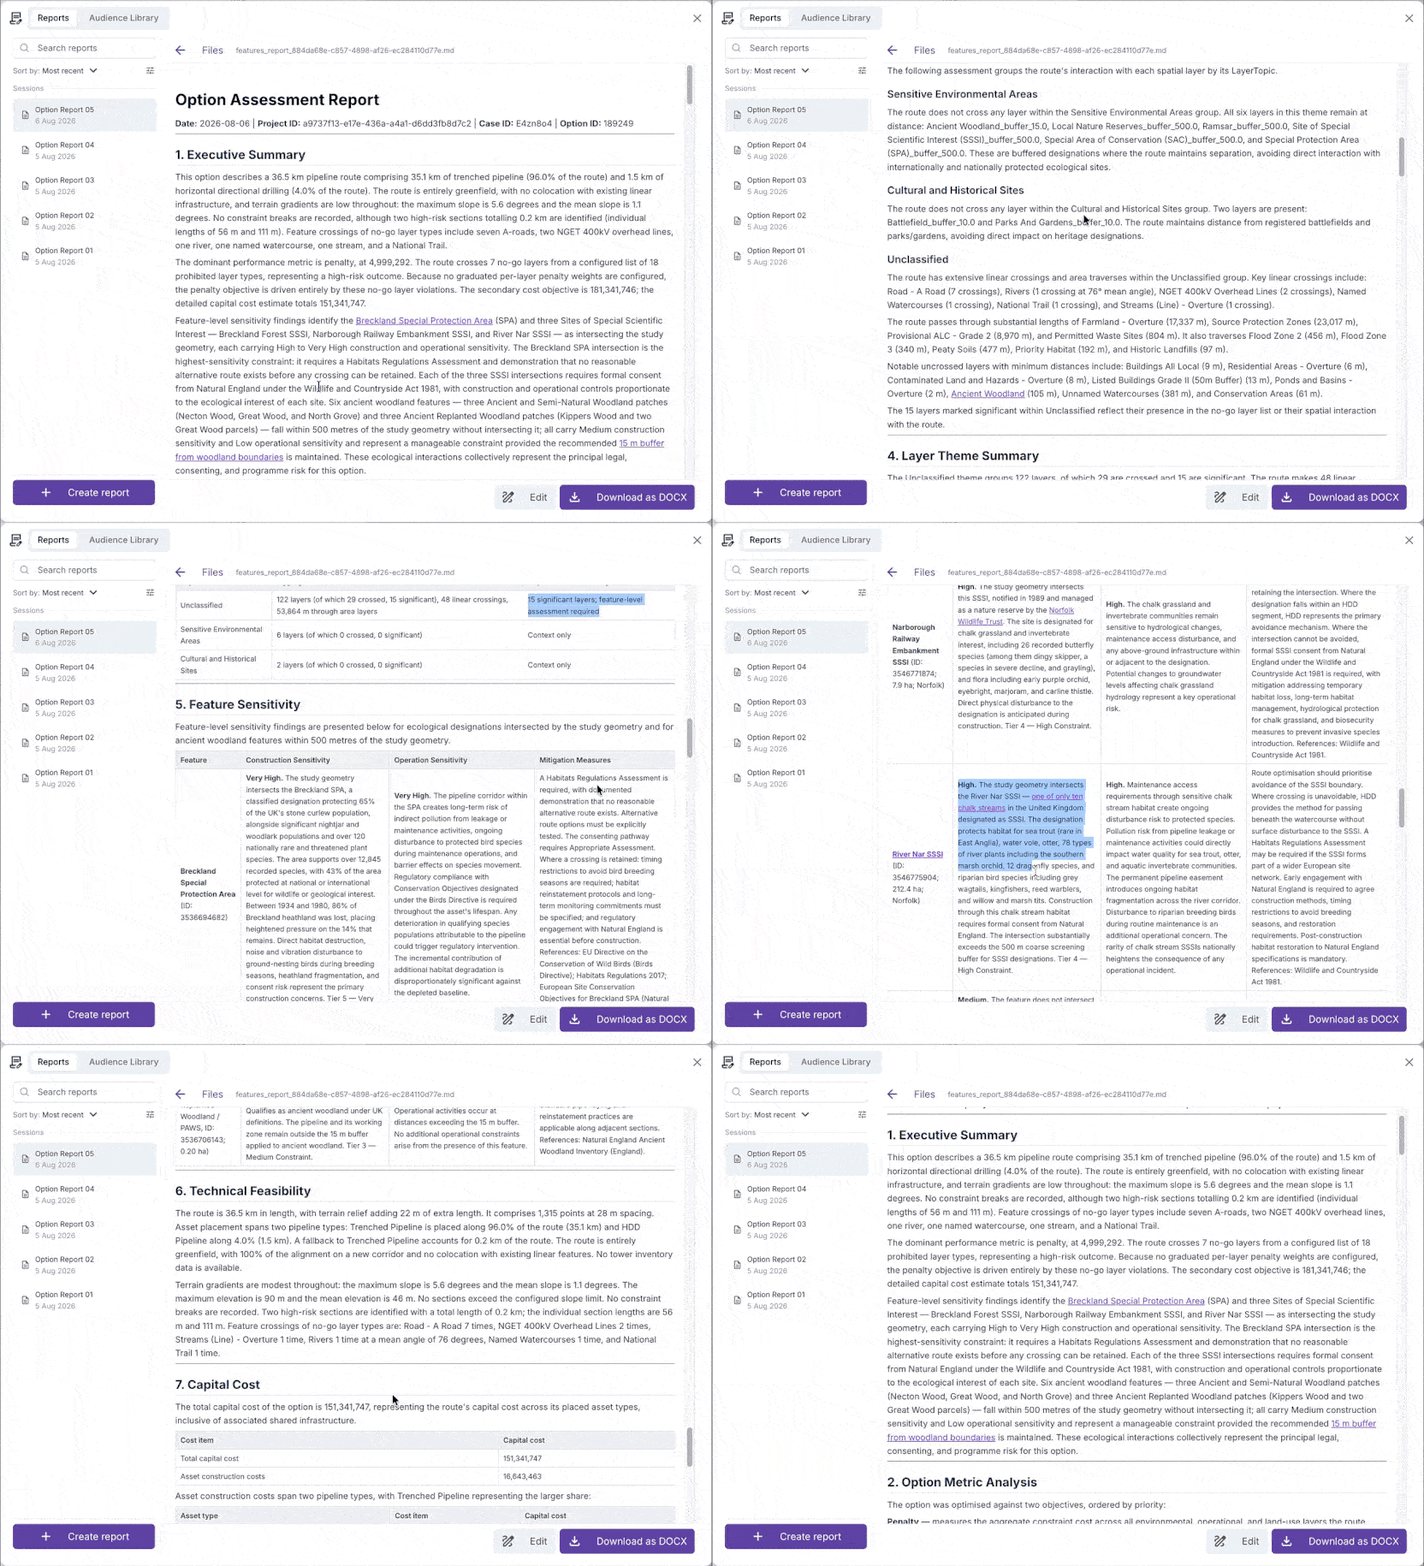
The report gets drafted, section by section, from real project data, cited and traceable back to the dataset, layer or guidance document behind each claim.
.png)
Where something genuinely isn't in the project, Report Writer can look it up, and it shows you where the answer came from so you can accept it, replace it or reject it. Where it can't be found at all, it says so plainly. A flagged gap is worth more than a confident error.
It reports your project, using your project data. Real asset placements, real locations, real numbers, real constraints and permits required.
Sensitivity and significance are derived, not guessed. Summaries are customizable, with defaults drawn from the relevant guidance for each feature type and matched to jurisdiction, so a US federal framework and English planning policy produce appropriately different reasoning, and two reports on similar receptors reach consistent conclusions.
Every claim carries its source. A reviewer can trace any statement back to its evidence instead of taking the document on trust.
Significance travels. What counts as important is drawn from the configuration that generated the option - what it was told to avoid, what was penalized - so the reasoning stays defensible across geographies and projects.
Your data stays yours. Report Writer runs on your project data inside your own Optioneer workspace, to draft your reports and nothing else. Your project data and your templates are not used to train models and are not visible to any other customer.
“Overall, the documents are directly usable as detailed summaries of route and capital information and, with only minor amendments, could be incorporated into an options assessment report as route option appraisals.” - Project Manager at a utility serving 4 million customers
Current situation
System planners develop multiple scenarios for the future, assessing potential network interventions against a range of cost, operational or economic criteria. This analysis relies on a node-to-node model (for electricity, represented by busbars that are not geo-located).
The model carries no representation of the real world: options are assessed on straight-line distance and a 'markup' multiplier. We see the same two failures repeatedly. Landscape constraints go unnoticed until an option has already been selected, at which point the undergrounding needed to make it work can add eight figures to delivered cost, when a slightly longer overhead route was available all along. And portfolios get built on straight-line assumptions that, once drawn properly on a map, would run through dense urban areas no transmission project would realistically cross.
System planners lack tools that can surface key feasibility insights into the engineering, permitting, and other constraints associated with new lines and upgrades, and the siting and land teams do not have the capacity to evaluate the volume of projects being considered at this stage. Looking at a map helps, but lacks consistency and methodology; currently, the options are well specified and understood from a system perspective, but they are not tested against real-world assumptions.
With the Report Writer in Optioneer
For every option evaluated in a plan, users can get key feasibility insights within minutes. In the background, Optioneer assesses millions of options and identifies the routes and upgrades that best satisfy the constraints the plan has set. On that basis, key metrics for the route get calculated. The user has a choice of either using the map and metrics as input to their decision making, or requesting a written exec-summary style report.
These reports can be shaped by the intended audience (in this case, a portfolio-level decision maker) and template, with consistent headings, insights in each section and contents that can be aggregated against hundreds of options in the portfolio. Additional information goes into the appendix, and the level of detail is configurable.
Current situation
A single employee is responsible for the early-stage assessment of strategic options feeding a long-term resource plan. The assessment has to establish both the feasibility of each proposed solution and its cost. Those deliverables are a standard input to the benefit-cost analysis that underpins the plan.
In the past, options were assessed at a very high level: an approximate location, or a corridor drawn between two points. Actual corridor layout, precise length and material environmental risks were barely considered.
Options were often rejected before being properly studied, or committed to because they looked attractive and then turned into a delivery problem. Only 10 or 20 options were properly studied in a multi-year cycle, which left a growing backlog of shelved and never-tested ideas.
For the funding cycle they decided to test a far more complete portfolio, pulling the shelved ideas back in. That leaves one person a few months to assess over 100 options and produce both a high-level strategic summary and a detailed record for each.
With the Report Writer in Optioneer
With Optioneer, this customer can explore all of the options in bulk, developing a solid shortlist of possible solutions with key metrics and KPIs. These allow objective scoring and comparison of all 100+ options, in a single table, against a set of key criteria.
This customer can set up two templates:
Both run in parallel and complete in 2-3 hours per option. At that rate the full 100+ option portfolio is a few weeks of one person's time, against a multi-year cycle that previously delivered 10 or 20 studied options.
Current situation
The internal template of a major European transmission operator requires every option in its strategic option review to be appraised against tens of criteria spanning ecology, cost, landscape and visual impact, historic environment, socio-economics and more.
Each criterion follows a repeatable pattern: describe the baseline, summarize the impacts expected during construction and operation, state the likely mitigation, and give a red-amber-green rating. Across the full criteria set, that is several hundred individual fields to populate per option.
Establishing the inputs means manually counting interactions with hundreds of constraints, checking for key crossings, looking up the nature of each constraint affected (often a simple web search) and then writing the description.
The process is repetitive and takes around 2-3 working days per option to complete. Some of the studies include as many as 20, 30, 40 options that need to be evaluated. Due to the volume of the work, the process often involves multiple subject matter experts, leading to inconsistencies and lengthy reviews.
At this stage no shortlist of route options exists yet, so the study is detailed because of the number of criteria, but still indicative: the eventual corridor could sit some distance away.
With the Report Writer in Optioneer
Each strategic option is run through the platform, with Optioneer exploring possible corridor locations and surfacing the ones that best satisfy the constraints set for the study.
Users can either work from the shortlist metrics directly to build the assessment for each option, or ask Report Writer to turn the quantitative assessment into the written format.
Report Writer works through the option data, matches it to the intended template, and makes sure the insights are relevant to the audience. It fills in the report and puts every criterion applied in front of the reviewer, with the source behind it, to check and correct.
Generation takes about 20 minutes and runs in parallel across every option. Review takes roughly an hour per report, about what it takes to read 20 to 30 pages, with each statement checked against the source it cites. The engineer still decides what the assessment says. Report Writer removes the assembly work in front of that judgement.
Overall, assessing 20-30 options moves from around three months to around a week.
.png)
Instead of replacing the expert, the Optioneer Report Writer removes the part of the job that was never expert work in the first place: sourcing the data, reconciling the layers, counting the interactions, assembling the first draft. What's left is the analysis and the judgement.
Report Writer is available to Optioneer customers through an early access program, with support from our team on templates and audience configuration.

.png)